
Assessing Tournament Poker Player Profitability
Are poker players as profitable as reported tournament results suggest?

Two recent posts about poker caught my attention.
Derek Wolters recounted his experience in trying to buy pieces of players deep into the World Series of Poker main event.
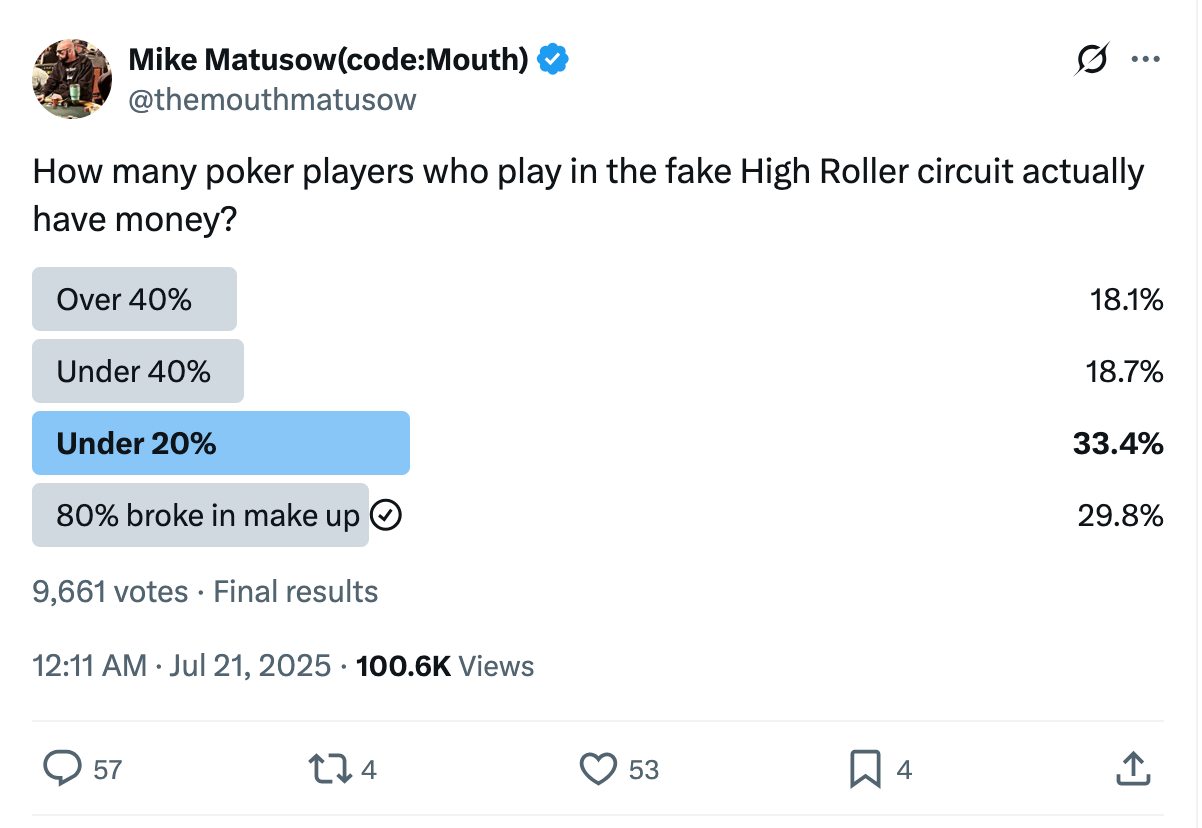
Mike Matusow posted a poll about what fraction of players in the high roller tournament scene have money.

The two posts are related in that Wolters’s talks about buying a fraction of a player’s action mid-tournament. Matusow talks about the possible lack of liquidity among some tournament professionals, which might make the potential reduction in variance of Wolters’s offer attractive. Being able to handicap poker player ability based on limited information plays a crucial role here.
The poker staking economy
Because this is a discussion about evaluating poker players and finding potential value in player tournament results, the need to effectively handicap poker players based on limited information plays a crucial role. So while poker is the context for the post, the thought process and techniques used are much closer to those used in sports betting.
With that said, I have generally avoided staking poker players for a number of reasons: some reasons are related to the math I’ll show below and others have nothing to do with math at all (and which aren’t relevant here).
My instinct when I first read Wolters’s post was that the approach very unlikely to be lucrative for a few reasons:
Information asymmetry: the player knows much more about his overall ability and about his current state of mind and position in the tournament than a backer possibly could. Hendon mob is the main resource available to gauge player ability, more on which later.
Adverse selection: the players who sell a piece of their action will tend to do so when the offered price is too high (based on the information asymmetry above). The possible reasons for this asymmetry are too many to mention: maybe he’s playing bad this tournament but has been lucky to get this far, or he’s starting to feel sick, or he knows that his playing style is not suited to a big score necessary to realize the full ICM value.
In order to profitably buy pieces mid-tournament, one needs to both identify players who (i) have an edge over the remaining field and (ii) are looking to sell a piece of their action. I suspect there is not much overlap between these two groups, meaning that if you do find someone who is looking to sell action then they are much less likely to have an edge over the remaining field than originally thought.
Pre-tournament staking
It seems to me that a backer is much more likely to get a good deal by buying pieces before the start of the tournament, rather than in mid-tournament. Information asymmetry and adverse selection still exist pre-tournament, but those disadvantages are limited to pre-tournament factors.
The pre-tournament price is based on the perceived value of entering the tournament, allowing the backer to realize the “ICM value” of the worst players in the playing pool. But mid-tournament, the value of the worst players has already been absorbed into the ICM value, because those players have been eliminated from the tournament. The players left will be disproportionately stronger players, making it harder to identify players with a significant edge above ICM. And, as mentioned above, those players with a big edge are the least likely to want to sell — again, adverse selection.
Another crucial factor that favors staking pre-tournament over mid-tournament staking is alluded in Matusow’s post: if a non-negligible percentage of poker players is effectively broke and cannot afford to buy themselves into the tournaments they play, then there is an opportunity to stake certain players that have a huge advantage over the starting field once they are in the tournament. These are the players who need backing before the tournament, but who would almost never sell a piece of themselves deep in a tournament.
Of course, staking pre-tournament is as old as tournament poker, with well known stories of Billy Baxter staking Stu Ungar for his win in the 1997 WSOP main event. But that gets us back to Matusow’s post:
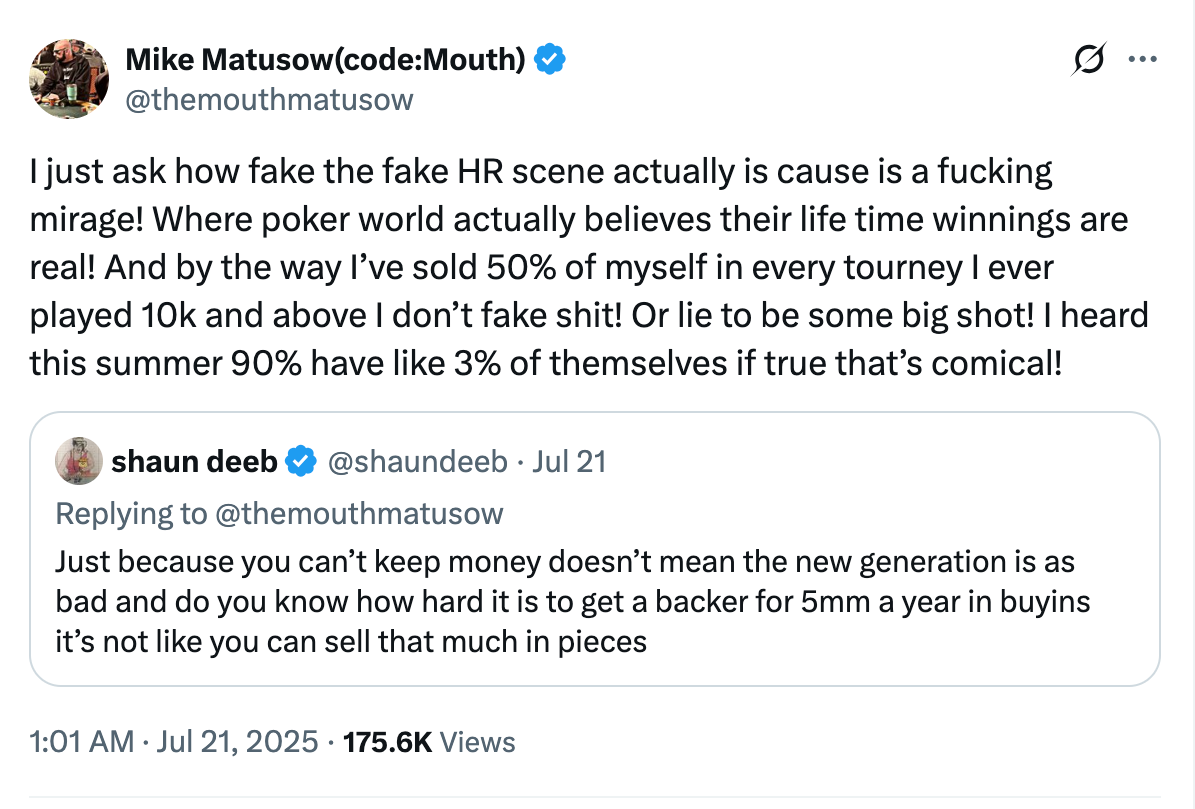
I don’t know how true Matusow’s claim is, but it seems possible that a relatively small and closed group of players, who consistently play against each other for very high stakes, cannot all be profitable. (The issue is compounded by the substantial travel costs of playing the tournament circuit. I won’t consider extra expenses here, but it must be kept in mind when interpreting the numbers below.) And Matusow’s claim would also support the thesis that there are good poker players whose financial difficulties present an opportunity for a backer to profitably stake them pre-tournament. Matusow might even say that he is one such player.
Analysis of Hendon Mob Data
I will discuss a possible way to evaluate poker player profitability using the Hendon Mob (HM) poker database. HM contains results for a large number of tournaments, including many small stakes events in the US and high profile events worldwide.
Aside from any tournaments missing from Hendon Mob, the database has a few limitations for the question we want to answer:
Even for the tournament finishes listed, the database only displays the total amount of cashes, and not the total buy-in amounts for those cashes.
As many tournaments now offer unlimited rebuys, the results on Hendon Mob do not contain information about how many entries (“bullets”) a player entered in a tournament.
HM only records in-the-money finishes (“cashes”), and therefore does not give a complete picture of all the tournaments in which a player entered and lost the entire buy-in.
Because HM displays a list of all cashes along with the buy-in for each of those tournaments, the first point is easily handled by parsing the data on a given player page and adding up the total. The second issue, concerning re-entries, cannot be addressed here and will be ignored — just keep in mind that whatever we estimate should be downweighted by some amount to account for rebuys. Addressing the third issue is where things get interesting, and where we can get a window into both Matusow’s claim about the poker economy and which players would be most profitable to back. The analysis is given below.
Disclaimer 1: the numbers and any conclusions given below are based on limited information and interpretation of data contained on Hendon Mob. It relies on assumptions that may not be true for all players and does not consider additional factors that contribute to player profitability, such as swapping and buying pieces of other players, cash game wins/losses, losing money in the pit, or crypto. Note also that any estimates about profitability does not factor in other costs, such as travel, which are a non-negligible expense for tournament poker players.
Disclaimer 2: the analysis below is preliminary and could have errors due to mistakes on Hendon Mob or data processing errors.
Disclaimer 3: if you’re a big shot poker player and your name isn’t mentioned, don’t take it personally, but feel free to reach out and I will consider adding you in a future edit. If your name is mentioned and the conclusion drawn is wrong, please point out the error and I will refine the approach accordingly.
Estimating Player Efficiency and Profitability
Return on Investment (ROI) is defined as a player’s average return for every dollar of buy-ins. A player with a total of $10 million in cashes and $8 million in buy-ins would have a profit of $2 million on $8 million invested, for an ROI of +25%. A player with $10 million cashes on $10 million buy-ins has an ROI of 0% (a “break-even” player). And a player with $10 million cashes on $15 million buy-ins has an ROI of -50%.
ROI is really the only thing that matters, from both a backer’s and a player’s perspective. But we cannot directly measure ROI from Hendon Mob, because we don’t know about all of the tournaments that aren’t listed in the database — in particular, the ones in which the player cashed for $0 and lost the entire buy-in. In order to gauge this, we need to estimate how often a player finishes in-the-money.
To do this, I define the efficiency score as the ratio of cashes to buyins among all in-the-money results. For example, according to Hendon Mob, Daniel Negreanu has about $55.8 million in cashes on $7.1 million in buy-ins, for an efficiency score of 7.9. Allen Kessler has $4.5 million in cashes from $980K in buy-ins, for an efficiency score of 4.6. Mike Matusow has $8.9 million in cashes from $1.1 million in buy-ins, for an efficiency score of 8.1.
A player’s efficiency score can be interpreted as the player’s average ROI when they cash. So a player who tends to convert cashes into big scores will have a higher efficiency than a player who tends to min-cash. Naturally, this score can be disproportionately influenced by a small number of very large cashes, such as winning the main event, which is more likely to indicate short-term variance than a systematic edge. This effect is mitigated for established players with a long history and with a relatively large number of buy-ins. I’ll discuss some possible ways to deal with this later.
Another way to use the efficiency score is to convert it to a break-even cash frequency, which can be calculated as 1 / efficiency. For Negreanu, this number is 1 / 7.9 = 12.6%. For Kessler, this number is 1/4.6 = 21.7%. For Matusow, this number is 1 / 8.1 = 12.3%.
Assuming (1) the distribution of buy-in amounts on the player’s HM database is a representative sample of the distribution of buy-ins for all tournaments that the player plays and (2) the distribution of cash to buy-in is representative the player’s overall distribution of cashes, the break-even frequency represents the minimum frequency that the player must finish in-the-money in order to be a break-even tournament player. Under these assumptions and based on the data we have, Negreanu needs to finish in-the-money 12.6% of the time in order to break even, while Allen Kessler needs to finish in-the-money 21.7% of the time in order to break even.
Finally, we can get a range of possible estimates for each player’s ROI by considering possible ranges for the player’s actual in-the-money percentage and comparing to the break-even frequency. For example, using a cash frequency of 15% as a baseline, because many tournaments now payout to the top 15% of the field, Matusow’s ROI would be 22%, Negreanu’s ROI would be +19% and Kessler’s ROI would be -31%.
We probably should expect a professional or skilled player to cash at a higher rate than this baseline. We consider make specific observations and consider some different scenarios below.
Analysis
Below I’ll use 15%, 20%, and 25% as low, medium, and high estimates of actual in-the-money percentages. These choices are based on the baseline percentage of 15%, which should be a reasonable low estimate for most professional players, and the ITM percentage of 23.4% reported by Daniel Negreanu’s blog for the years 2013-2017. As Negreanu is a well-respected tournament player, his 23.4% number figures to be on the high end of the spectrum, so I expect 25% to be a reasonable upper limit (though it is possible some players do exceed this).
Of course, some players will finish in the money at significantly higher or lower frequencies, depending on their playing style and the difficulty of the fields in which they play. In weaker fields or with a particularly low variance style, it may be possible to cash 30% or more of the time. Conversely, it is possible to be profitable with a higher variance style that results in fewer cashes but for a relatively larger payout on average. Also, in the past, it was common for tournaments to pay a smaller percentage (10-12%) of the field, resulting in larger overall payouts.
Here is a table with the full results from the analysis so far. The players listed were chosen from among the top listed money winners or in-the-money finishes on Hendon Mob, plus other notable or well-known people. (If an important name is missing, or if you’re curious for a certain player, please let me know.).
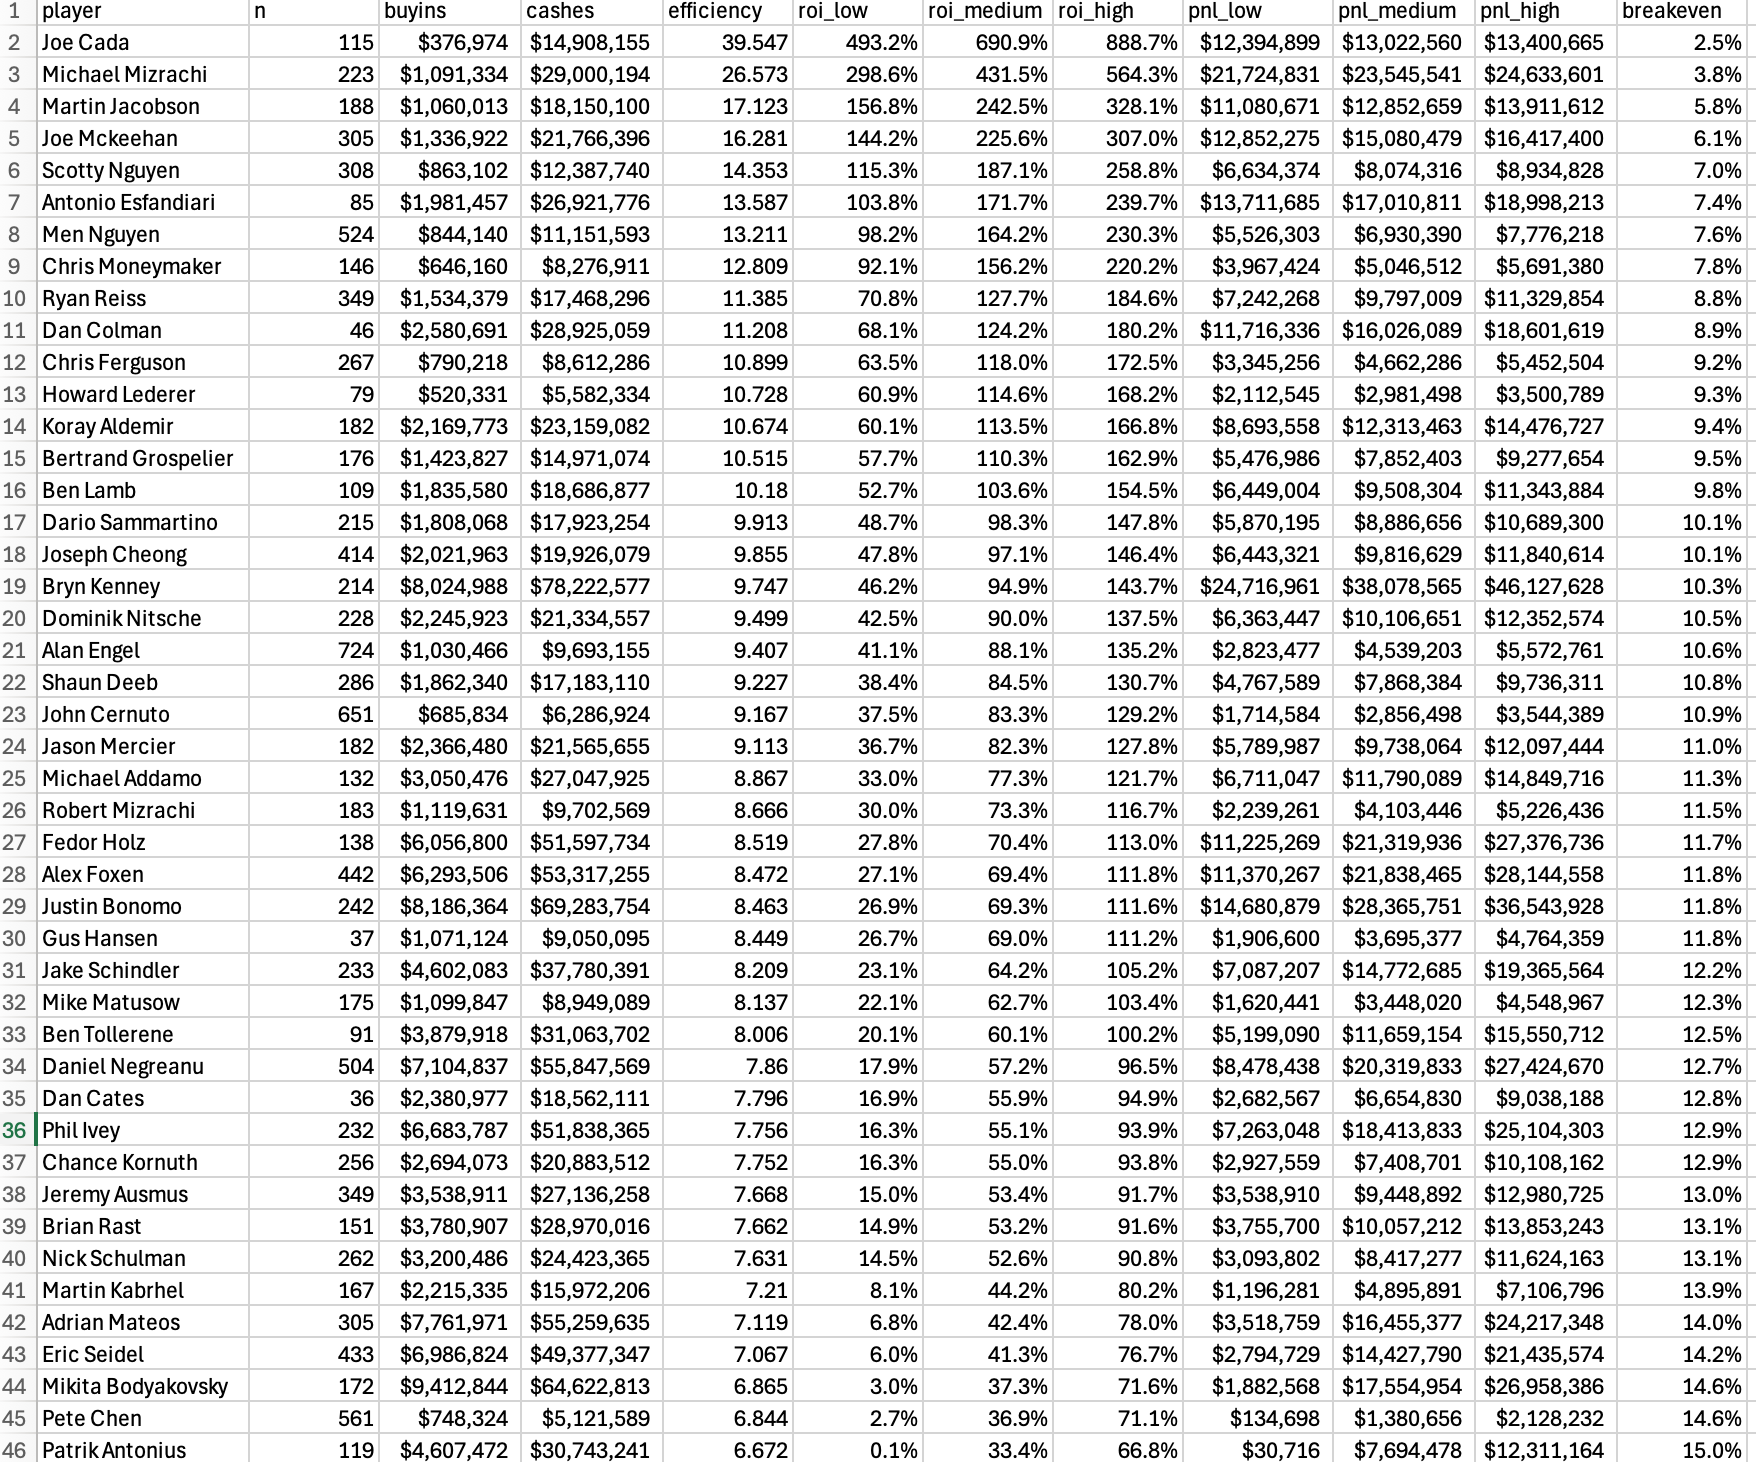
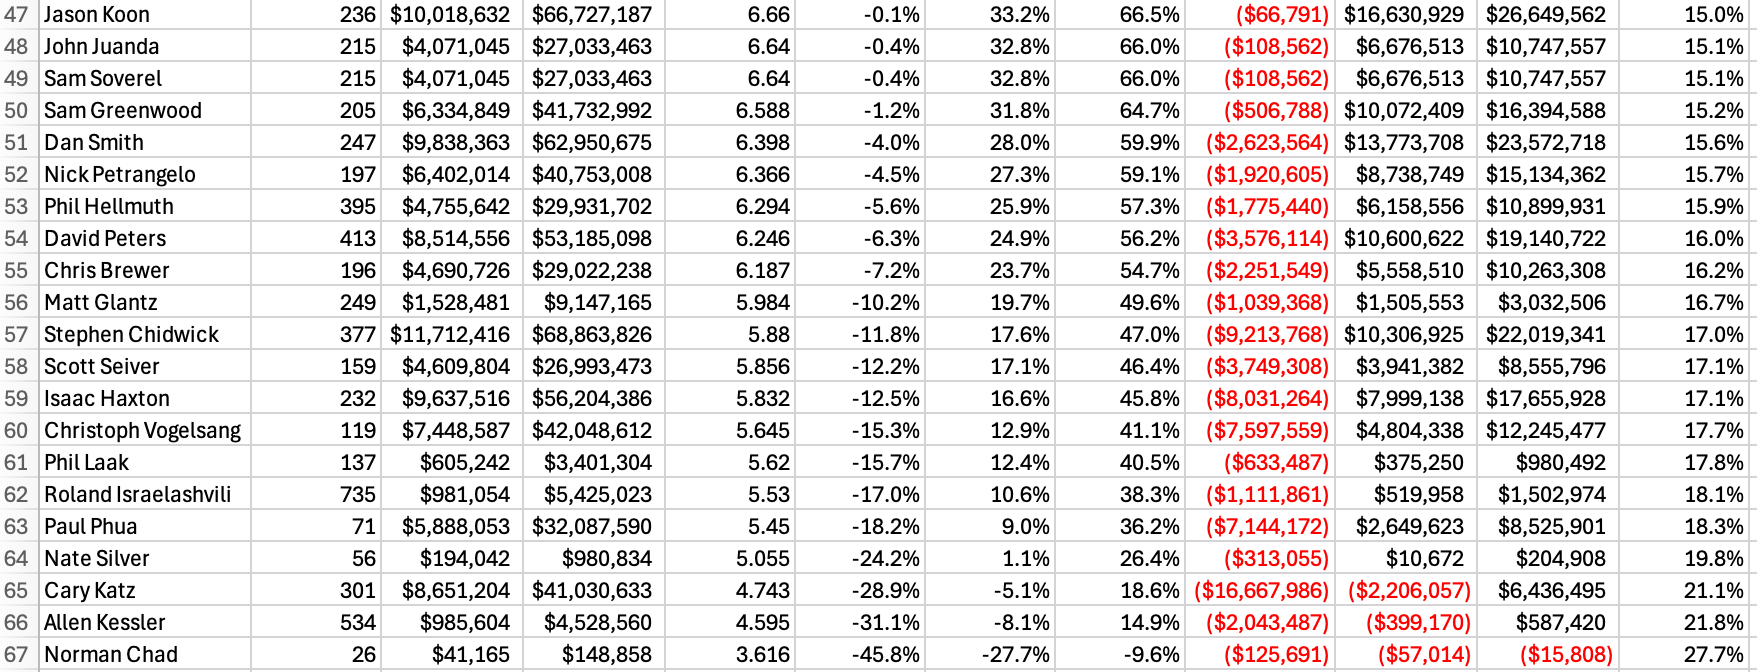
Here is an explanation of columns:
n: number of cashes listed in HM.
buyins: total amount of buy-ins on HM (in USD).
cashes: total amount of cashes on HM (in USD).
efficiency: player efficiency score (cashes / buyins), as defined above.
roi_low: estimated ROI assuming 15% cash frequency.
roi_medium: estimated ROI assuming 20% cash frequency.
roi_high: estimated ROI assuming 25% cash frequency.
pnl_low: estimated PNL assuming 15% cash frequency.
pnl_medium: estimated PNL assuming 20% cash frequency.
pnl_high: estimated PNL assuming 25% cash frequency.
breakeven: minimum cash frequency needed to breakeven (equals 1 / efficiency).
As this shows, the estimated profit-loss for most players is positive under low, medium and high assumptions on ITM frequency.
The list is ordered by efficiency. Naturally, some scores are inflated by a small number of very large cashes.
Notice also the wide range of possible profit-loss depending on actual ITM %. For example, Isaac Haxton’s estimated profit-loss ranges from a loss of $8 million on the low end to a win of $17 million on the high end. Michael Mizrachi, on the other hand, has a narrower range between $21.7-24.6 million in profit, indicating consistent results in lower buy-in events. Other notable players include:
Negreanu: $8.5-27.4 million
Matusow: $1.6-4.5 million
Kessler: -$2 million to +$500K
Norman Chad: -125K to -15K
The figure below orders players according to their highest pnl estimate. The figure below that orders players by their lowest pnl estimate.
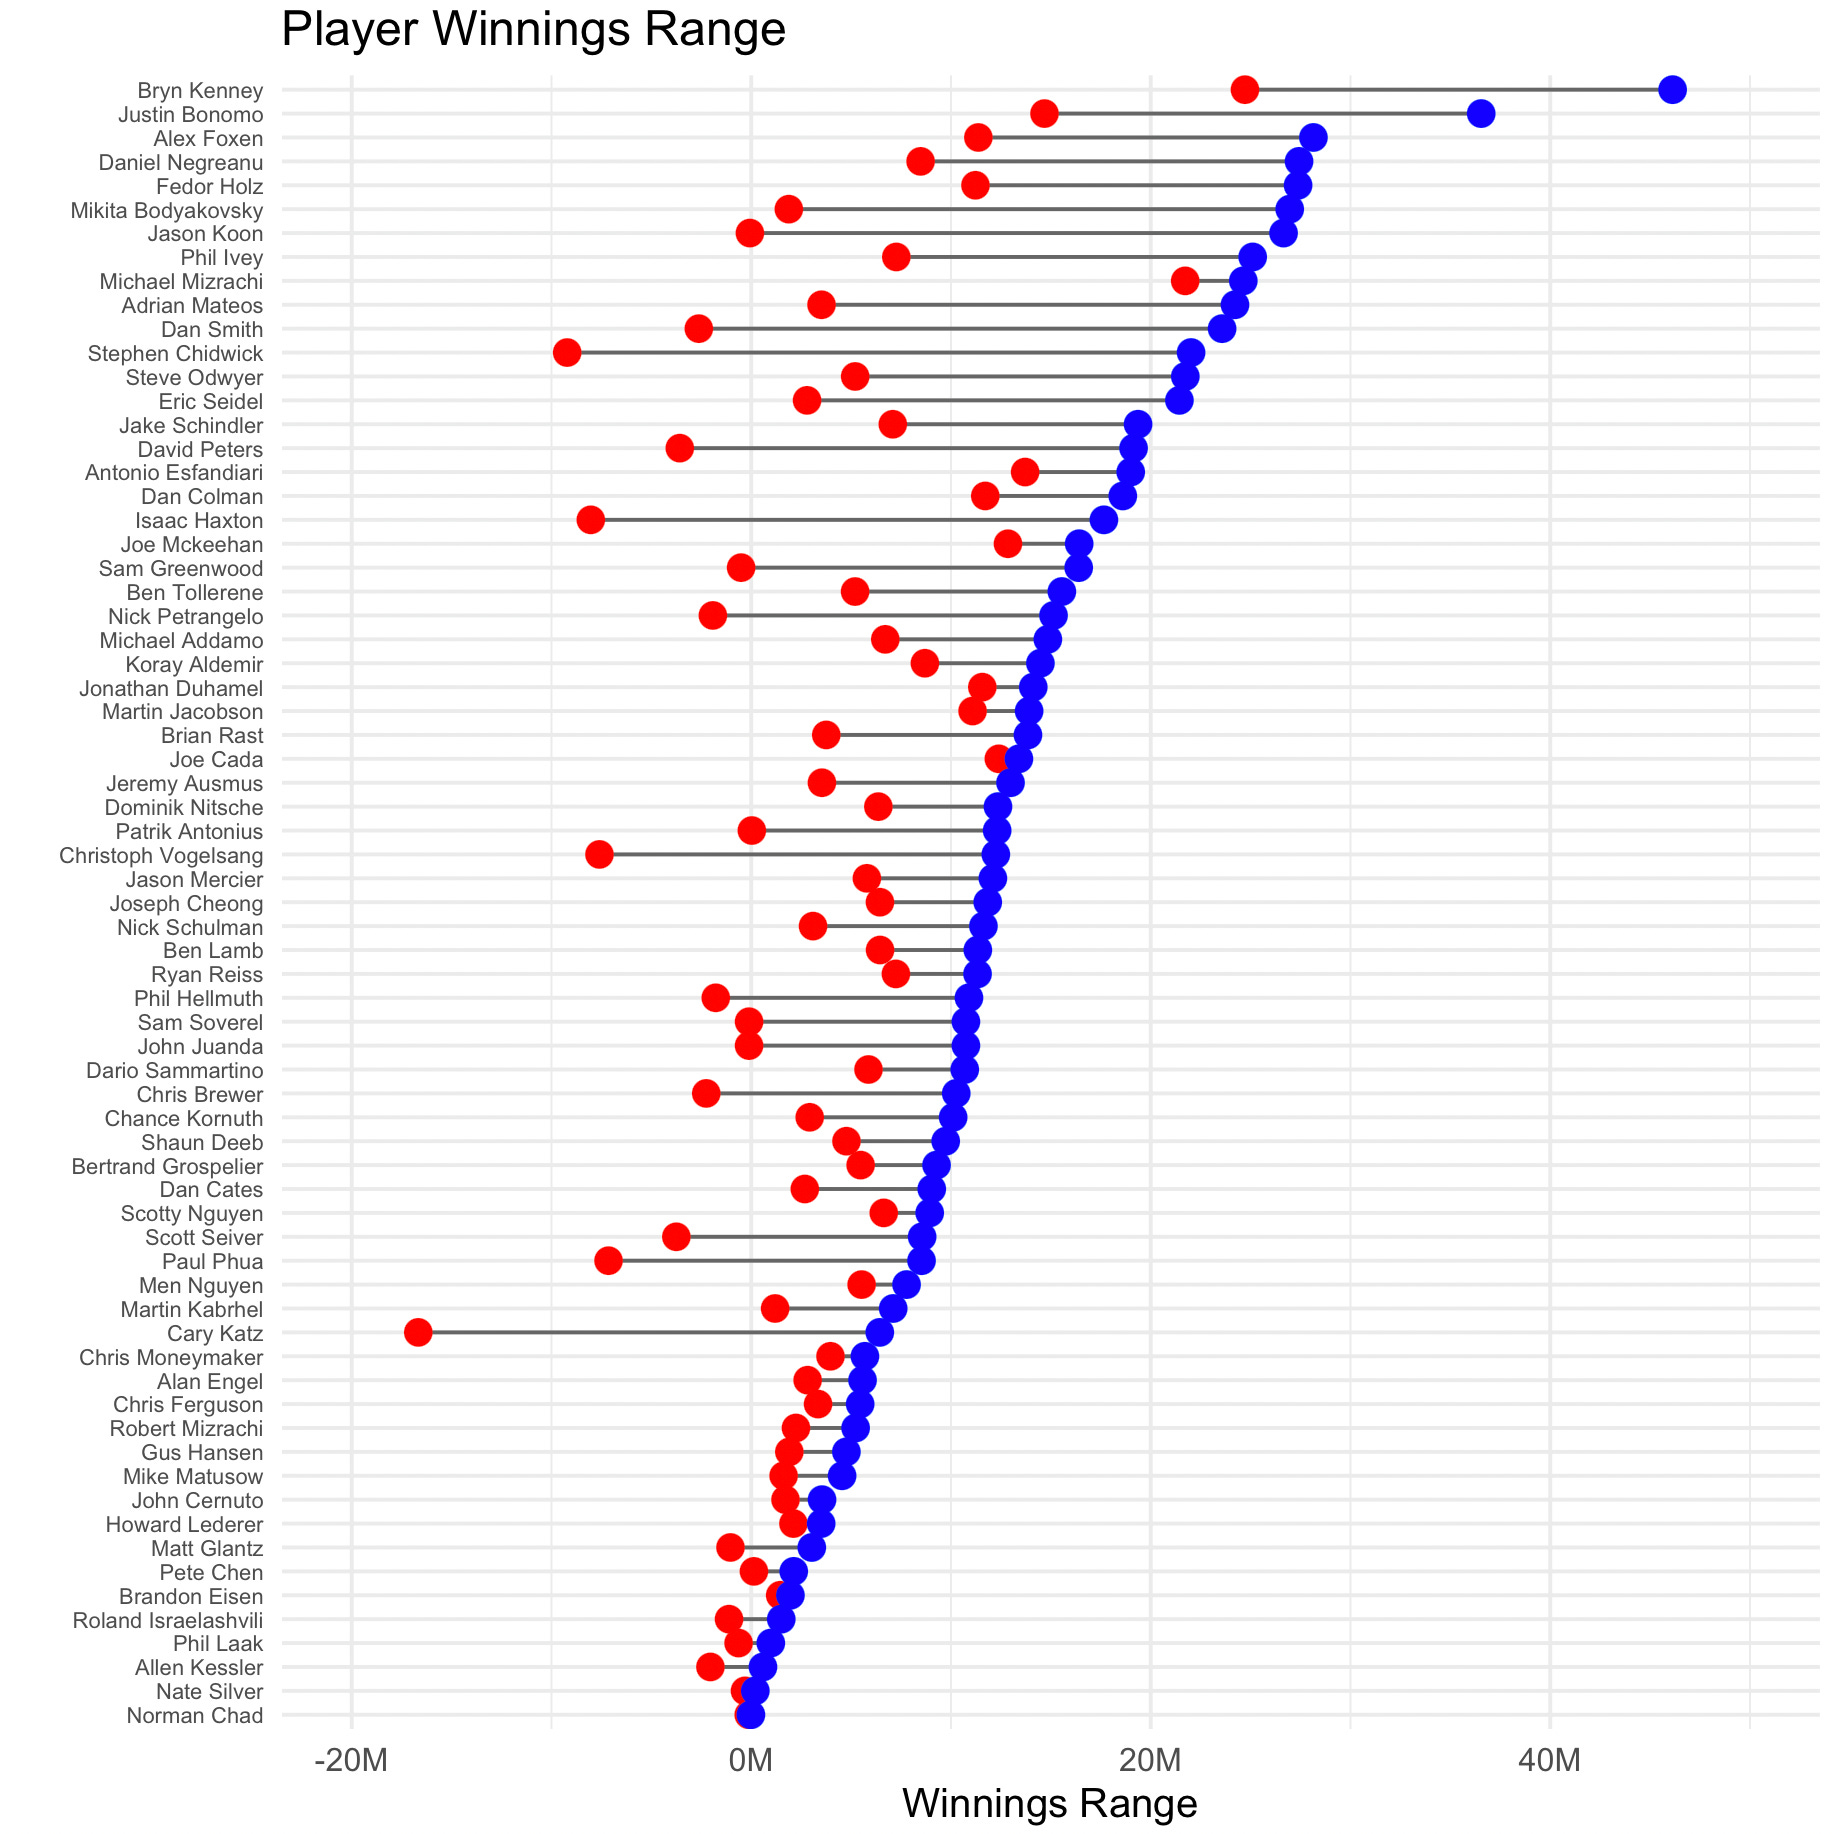
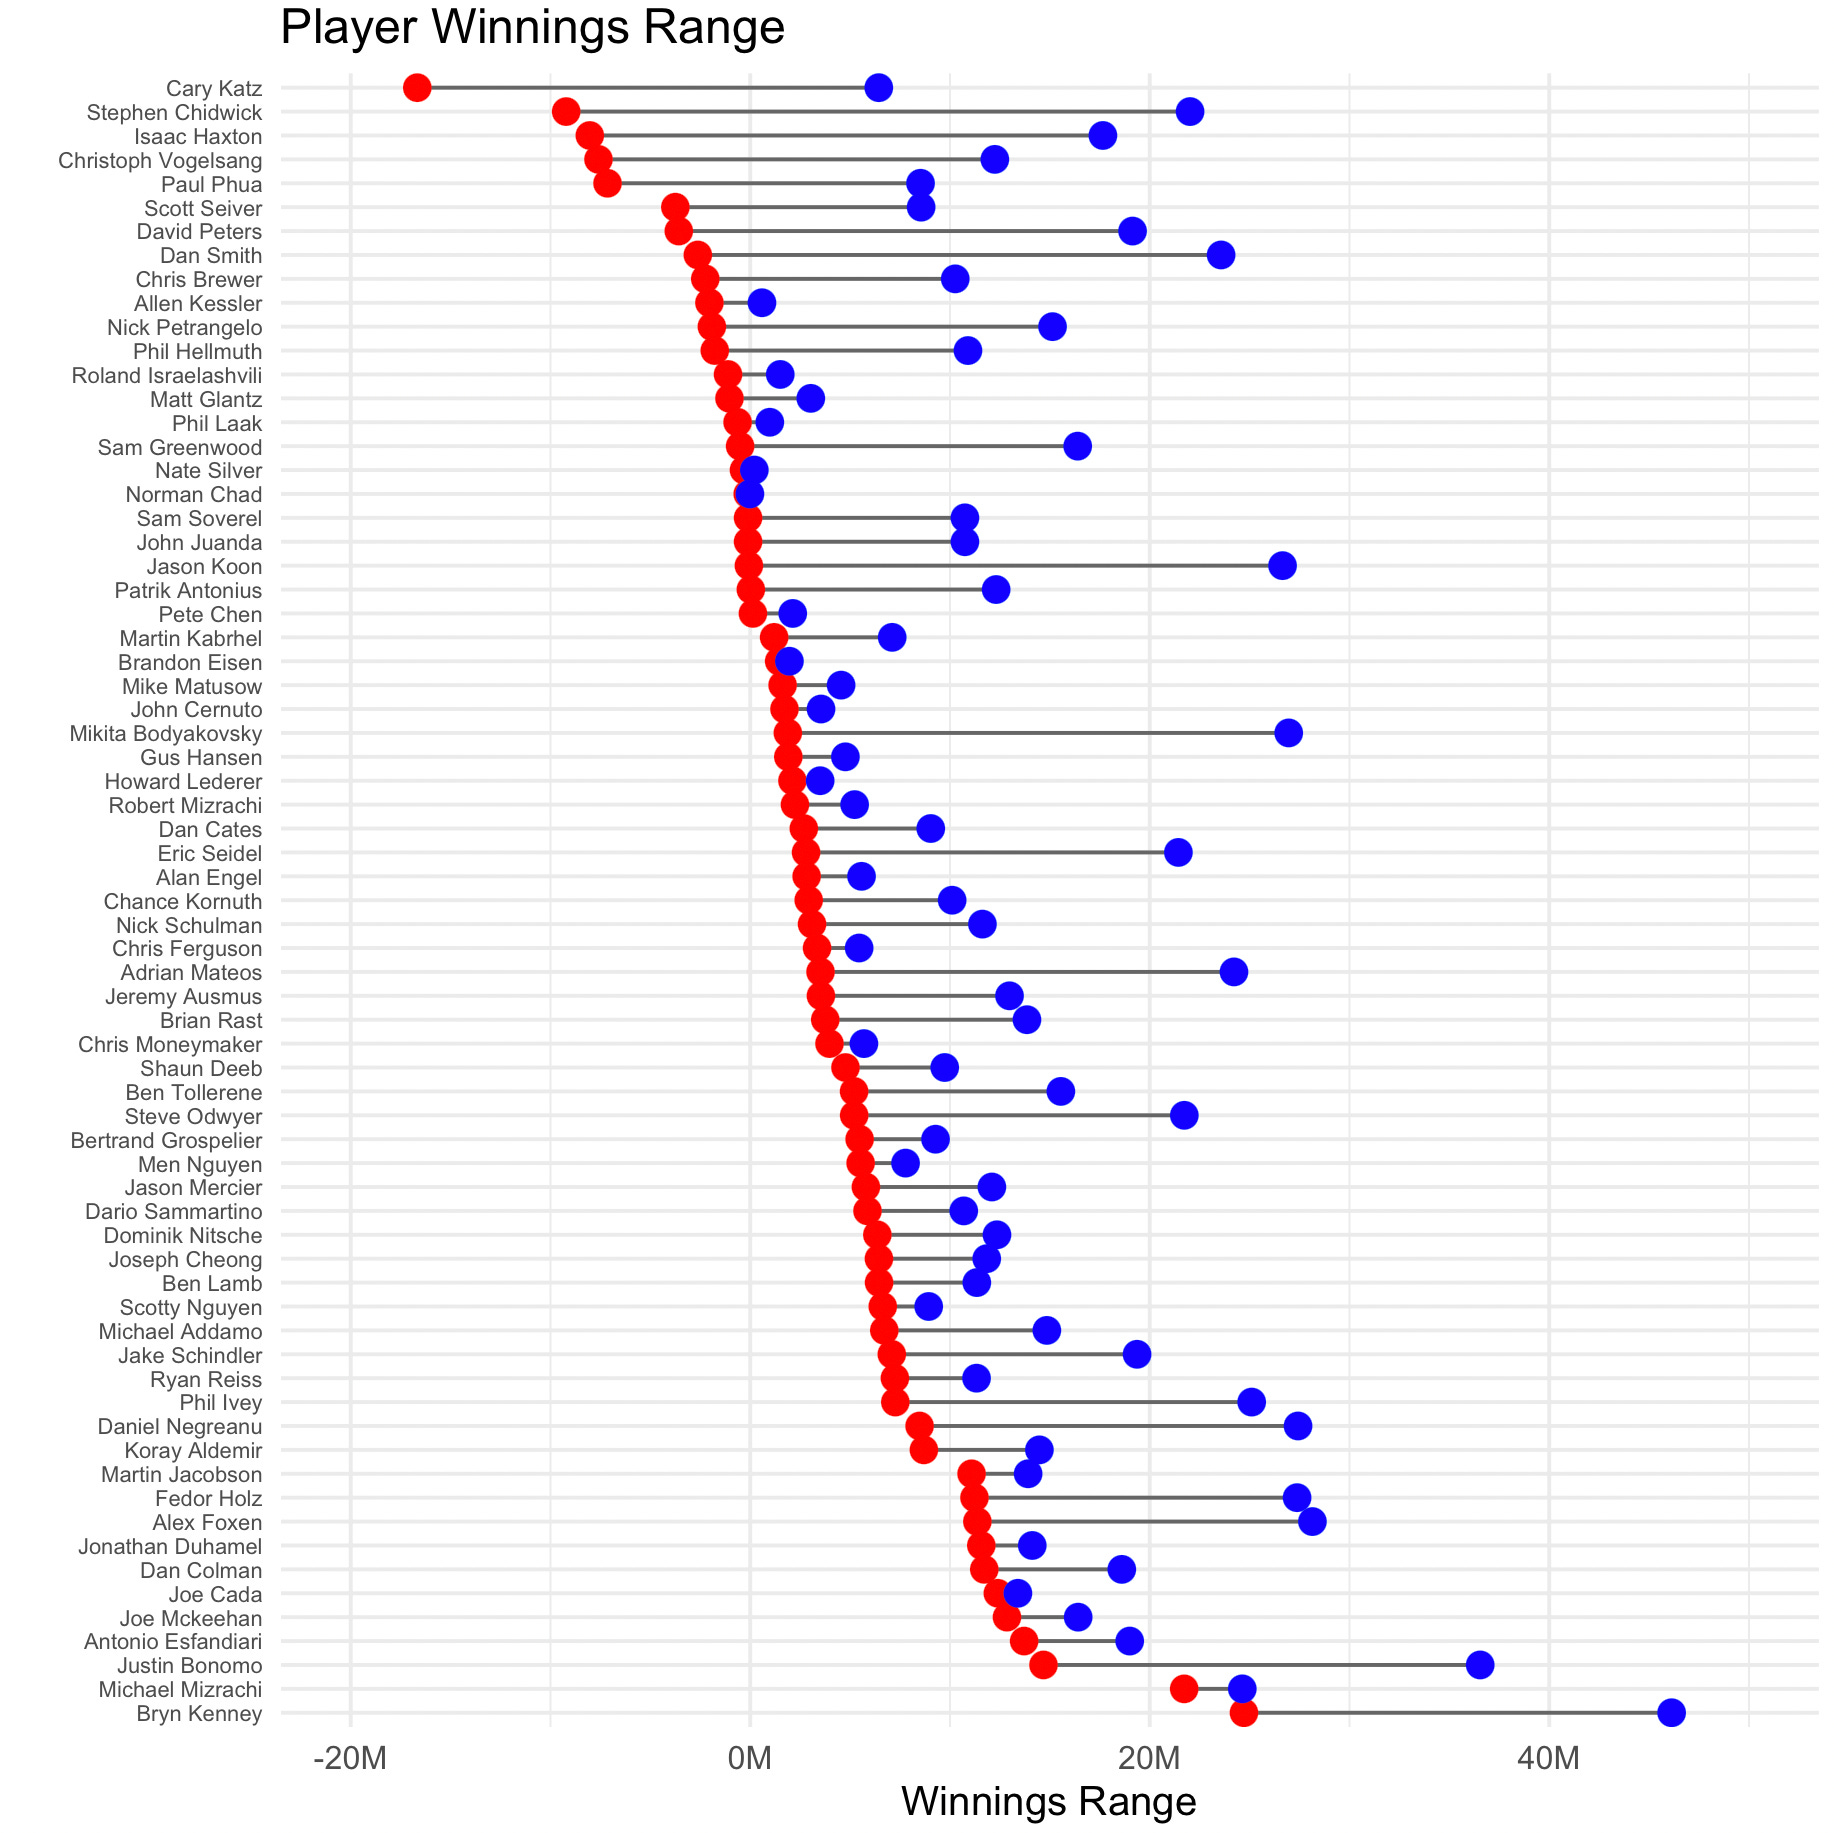
Any player whose line crosses the $0 line could conceivably be a losing player, but such would require that they cash at a baseline rate of around 15%.
These observations lend potential credibility to the claim in Matusow’s post. For sure, there are several notable players, especially among those in the high roller circuit, whose lines cross into negative territory. Beyond that, we see that the estimated upper limits on profit are generally far below what the Hendon Mob total cashes reports. To make a definitive statement would require a more accurate estimate of the in-the-money percentage.
Sanity check: How accurate is this approach?
In 2018, Daniel Negreanu wrote this on his blog:
I posted a poll on Twitter mentioning that in 2017 I cashed for $2,792, 104 and asked if people thought that was more or less than the total number of buyins I spent on the year. I mention this because I think my 2017 was a good illustration of the illusion that players cashing for $2 million in a single year is a great accomplishment. In the old days, before super high rollers, you could all but guarantee that cashing for $2 million would mean the player had a winning year. Well, the truth is, if a player plays the full high roller schedule and cashes for $2 million, they are all but certain to have had a losing year, and that’s before expenses.
I felt like I had a decent year in terms of results, but when you break down the numbers into an actual profit vs loss, I essentially broke even!
Buyins: $2,874,164
Payouts:$2,792,104
Profit: -$86,140
He went on to summarize his tournament results for the years 2013-2017:
Events 291
Cashes 68
ITM % 23.4
Buy Ins $10,329,453
Payouts $19,062,527
Profit $8,733,074
Avg Buy In $35,496
For comparison, his HM database shows only 16 cashes between 2013-2017, perhaps highlighting the incompleteness of the HM database. Regardless, we can use this report as a way to evaluate the reliability of our method. During the 2013-2017 year period, Negreanu’s HM results have an efficiency of 8.03, for a break-even cash rate of about 12.5%. Using Negreanu’s report of 23.4% actual ITM percentage, we estimate his ROI to be about 87.9%. His ROI based on actual profits reported is 84.5%, using the total buy-ins of $10.3 million and profit of $8.7 million.
Although reliability of this method will vary depending on specific player tendencies, this test case suggests that the approach should be a good indicator for players who play a consistent schedule over a period of time, such as Negreanu.
Even with this, the approach is only as good as the estimated ITM percentage, which is hard to know without complete record of a player’s tournament performance.
I’d be interested to hear from anyone who has ideas for how to improve the above analysis, and especially anyone who would dispute anything written above, as I’m sure there is room for improvement. Based on this, I’m sure of one thing: I’m not looking to go out of my way to back any poker players any time soon.
The only thing I’d add is that tournament variance is so massive that if you ran 100 copies of a pro player with a 20% ROI and had each of them play 291 tournaments, about 45 of them would still finish in the red.